Version 2.29 of the Smartabase dashboard builder is ready for you to use.
If you haven’t tried the dashboard builder yet, check out our helpful guide. We’ll show you how to set up dashboards, use dashboard components and understand the data being displayed within your dashboards.
We’ve added some exciting new features since our last update. Enjoy!
Create column summaries for aggregation tables
We recently announced the ability to hide columns in the aggregation table widget when they don’t contain data, and now we’ve improved this widget even more with a column summary feature.
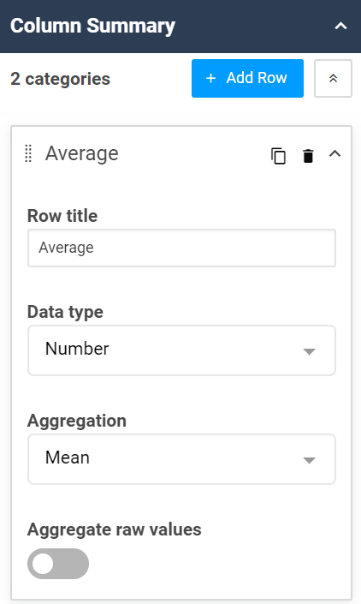
This feature is already available in the matrix widget and is similar to summary rows in the table widget, however, you’ve got additional flexibility when choosing an aggregation type for column summaries in the aggregation table widget.

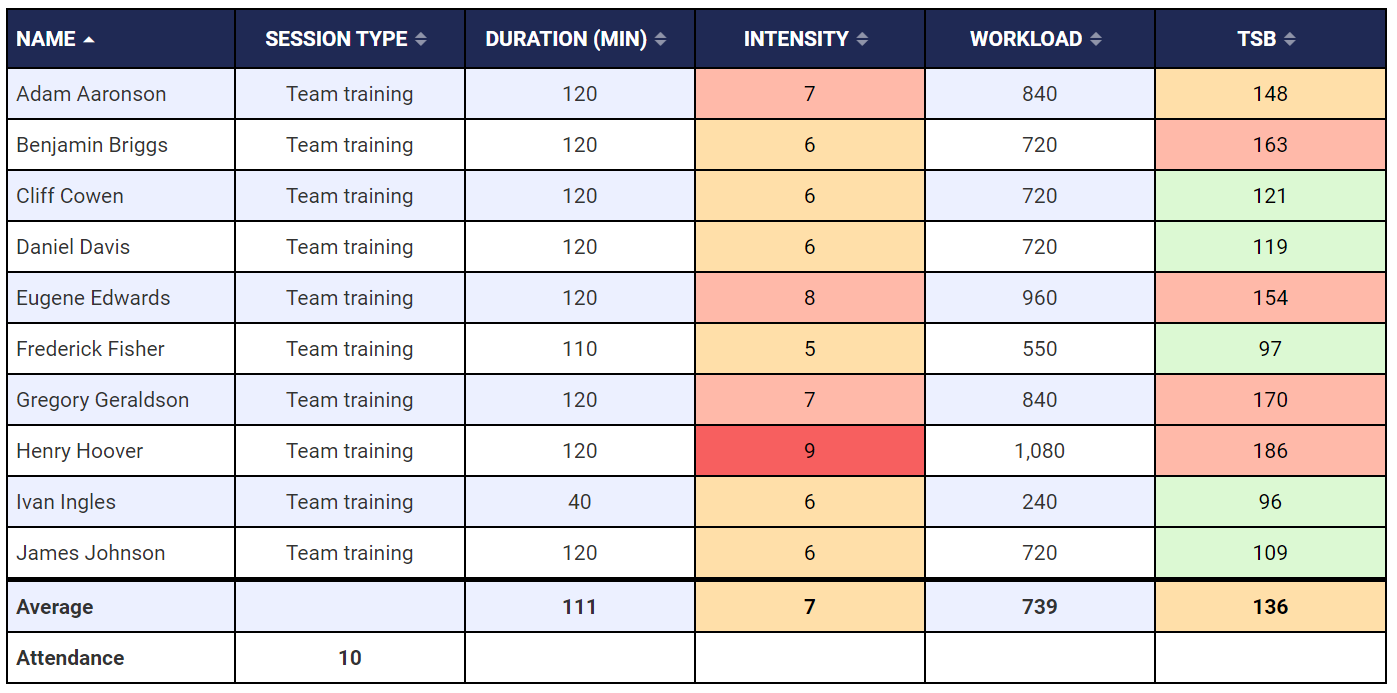
This new option is a great tool for seeing the bigger picture from your data in aggregation tables. In our example, the first column summary displays the average result of each numerical column. The second column summary (attendance) counts the total number of rows in the session column to show how many athletes attended team training.

General improvements and bug fixes
- You can now use the count aggregation type for string (text) data.
- We resolved an issue where regions on time series and categorical charts would not display correctly when printed.
- Blank dates were being displayed as invalid date in aggregation table cells. We’ve fixed this error, and these cells will simply appear blank.
Bug fixes that were released between 2.28 and 2.29
- We’ve temporarily removed the instructions property for canvases and sections. This feature isn’t ready yet, but please keep an eye out for its announcement.
- We fixed a problem that affected table widgets when no default column was specified for sorting purposes.
- We’ve solved an issue that stopped categorical charts from displaying in some instances.
- Categorical charts also had some problems with sorting order and category limits as well as null categories showing when they weren’t supposed to, which we’ve now resolved.
Highlights from your last dashboard builder release notes
In the last release notes we announced:
- An option for you to hide widgets when they have no data.
- The ability to print dashboards and exclude collapsed sections.
If you missed them, you can read the last dashboard builder release notes.