We’re pleased to announce more great news about some of the new features added to Smartabase’s dashboard builder.
If you haven’t tried the dashboard builder yet, check out our helpful guide. We’ll show you how to set up dashboards, use dashboard components and understand the data being displayed within your dashboards.
Expect the 2.19 update to become available to you shortly.
Move sections and widgets between canvases

You can specify which canvas to move the section or widget to and its location on the canvas. Here you can also choose to switch to the canvas you are moving the section or widget to.


The section or widget you decide to move will keep all of its settings in the new canvas. This includes the data it displays, any conditional formatting and advanced properties.
Redesigned canvas tabs
The canvas tabs have been redesigned to achieve a seamless appearance with the rest of the dashboard theme. The background colour of the area containing the canvas tabs now matches the background colour of the currently viewed canvas. This is particularly useful for dark coloured dashboards.

When building dashboards, canvas tabs now also collapse into a dropdown menu if they can’t all fit within the screen. You can arrange the order that these tabs appear in this menu.


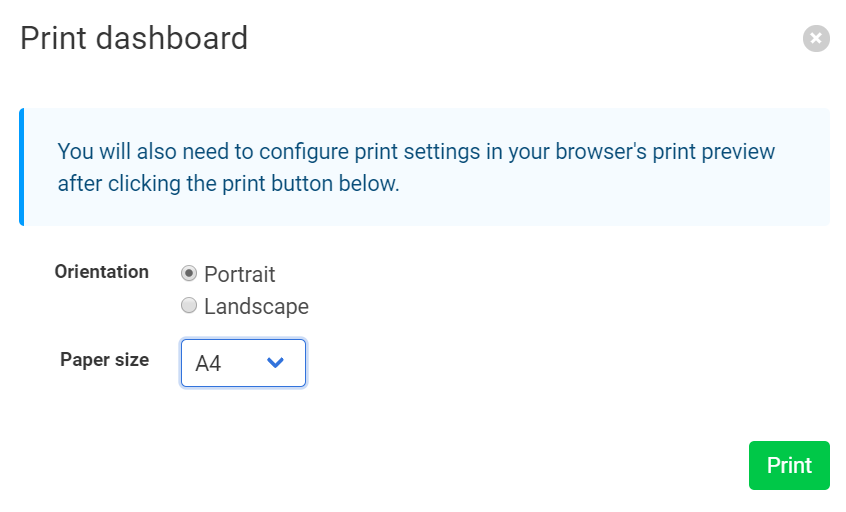
New layout for print settings
Print settings are now visible in a popup that appears when you choose to print a dashboard. Here you can choose the orientation and paper size you want to print your dashboard in.

More options for canvas titles and subtitles
Make your titles and subtitles stand out with more options to customise the text. You can now choose to show or hide both titles and subtitles in a canvas. You can also change the colour, size and alignment of the text depending on your preference.

General improvements and bug fixes
- X-axis tick labels can now be rotated anti-clockwise on categorical and time series charts.
- Resolved all instances of 414 errors that would occasionally appear when loading a dashboard.
- Resolved an issue where some categorical charts would cause the dashboard to load indefinitely.
- Resolved an issue where some popups would be cut off when viewing the dashboard on a smaller screen.
- Additional information in the about menu of the dashboard now appears in a popup.
You can contact your lead builder if you have any questions about building dashboards or visit the dashboard builder guide.
Highlights from your last dashboard builder newsletter
In your last newsletter we announced:
- The ability to filter options within a select box widget.
- Custom gridlines available in the XY scatter chart.
- The ability to customise placeholder text for tiles with no available data.
-
-
If you missed it, you can read the last dashboard builder update here.