Version 2.28 of the Smartabase dashboard builder is ready for you to use.
If you haven’t tried the dashboard builder yet, check out our helpful guide. We’ll show you how to set up dashboards, use dashboard components and understand the data being displayed within your dashboards.
We hope you have a great experience using version 2.28 of the dashboard builder!
Hide widgets with no data

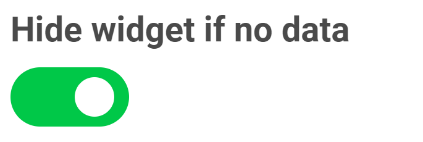
Often, when someone is viewing a dashboard, one or more widgets won’t have any data to display – because it hasn’t been recorded yet or doesn’t fall within a specific time period. Now, you can choose whether widgets should be hidden by default when they don’t have data.
This new feature is a great tool to keep the focus on what matters most in the dashboard. You can use it with all widgets as well as individual columns within the aggregation table widget. The property for hiding empty widgets can be found in the advanced properties for each widget. Widgets and aggregation table columns with this property enabled will allow other items to move up and fill the remaining space in the section for the dashboard.

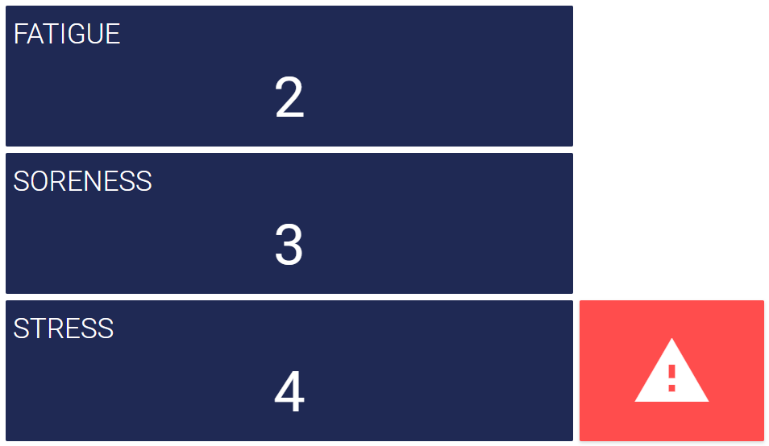
In this example, the warning tiles are set so they’re only visible when a metric of interest has been flagged (in this case, the data is the result of a calculation in the source event form). This allows a coach to easily and immediately see which areas of the athlete’s wellness need to be addressed.
Exclude collapsed sections when printing dashboards
When printing a data visualisation or report, it’s helpful to be able to choose which information you want to include or exclude. The dashboard builder already has a feature that allows you to hide specified sections when printing or creating a PDF, but this print setting was only available from the dashboard builder and wasn’t visible to viewers.
Now, anyone looking at a dashboard can select a section’s header to collapse the section and exclude it from a printout.
General improvements and bug fixes
- We’ve made more stability and performance improvements for tables and categorical charts.
- We fixed an issue where regions on XY scatter charts (with rotated axes) would not update correctly if the page was resized.
- We also resolved an issue that stopped widgets from displaying when they referenced a ruleset that had since been deleted.
Bug fixes that were released between 2.27 and 2.28
- We’ve sorted out an issue that prevented avatars from being displayed in some situations.
Highlights from your last dashboard builder release notes
In the last release notes we announced:
- The ability to create more accessible data visualisations with the legibility property for conditional formatting.
If you missed them, you can read the last dashboard builder release notes.