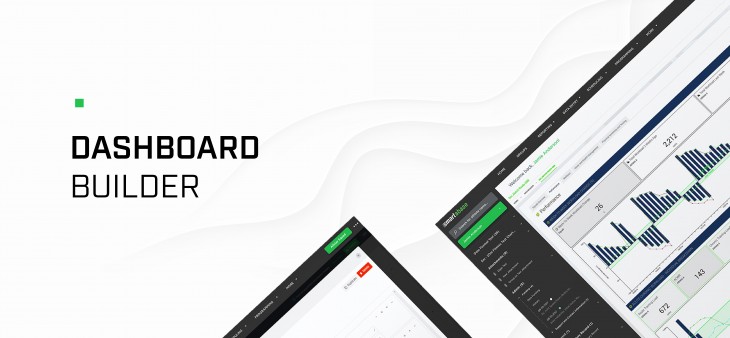
We’re happy to announce an update to Smartabase’s dashboard builder.
If you haven’t given the dashboard builder a go yet, we recommend looking at the dashboard builder help documentation. We’ll show you how to set up dashboards, use dashboard components and understand the data being displayed within your dashboards.
More date display formats
We’ve added support for more ways to display dates. You can choose to show dates as month/year or as week of year using different formats.
| Date format | Example Date 31 December 1995 |
| DD/M | 31/12 |
| MM/DD | 12/31 |
| DD MMM | 31 Dec |
| DD MMMM | 31 December |
| MMM YY | Dec 95 |
| MMM YYYY | Dec 1995 |
| MMMM YY | December 95 |
| MMMM YYYY | December 1995 |
| MM YY | 12 95 |
| MM/YY | 12/95 |
|
Week of year (1 2 … 52 53)
|
1 |
|
Week of year (01 02 … 52 53)
|
01 |
|
Week of year (W1 W2 … W52 W53)
|
W1 |
|
Week of year (W01 W02 … W52 W53)
|
W01 |
|
Week of year (Week 1 Week 2 … Week 52 Week 53)
|
Week 1 |
|
Week of year (Week 01 Week 02 … Week 52 Week 53)
|
Week 01 |
|
ISO Week of year (1 2 … 52 53)
|
52 |
|
ISO Week of year (01 02 … 52 53)
|
52 |
|
ISO Week of year (W1 W2 … W52 W53)
|
W52 |
|
ISO Week of year (W01 W02 … W52 W53)
|
W52 |
|
ISO Week of year (Week 1 Week 2 … Week 52 Week 53)
|
Week 52 |
|
ISO Week of year (Week 01 Week 02 … Week 52 Week 53)
|
Week 52 |
You can display dates within the tile widget, select box widget or the table widget. The chart widgets (time series, categorical, XY scatter) can also be used to show dates along the axes. You can use the new date display formats in any of these areas.
General improvements and bug fixes
- Values in tiles now obey your text alignment settings when you enable conditional formatting or select a vertical layout.
- If there are more than 1,000 options in a list, the select box widget will display all of them.
- You can now expect the X-axis and Y-axis ranges to work correctly when you set them for an XY scatter chart.
- If you duplicate an XY scatter chart, it will retain any filters you set up.
- The categorical chart now obeys the settings for area fill opacity and series line widths.
- Data points with no data don’t display anything if you hover over them.
- If you copy a dashboard, it’ll keep the name you give it (instead of reverting to the name of the original).
- When you set a table column to zero pixels’ width, the text won’t overflow.
- Categorical charts that have category limits but don’t have a series set won’t prevent your dashboard from loading.
You can contact your lead builder if you have any questions about building dashboards or visit the dashboard builder guide.
Highlights from the last dashboard builder update
Last time around we announced:
- More properties for the tile widget to add more flexibility for how you’d like to display it
If you missed it, you can read the last dashboard builder update here.