We’re excited to let you know all about version 2.30 of the Smartabase dashboard builder.
If you haven’t tried the dashboard builder yet, check out our helpful guide. We’ll show you how to set up dashboards, use dashboard components and understand the data being displayed within your dashboards.
Click to see the entire dashboard we made to use as an example for these release notes.
Add informational content to dashboards using the new content widget
Bring additional value and polish to your dashboards with a new widget designed specifically for rich, informative and beautiful content. The content widget allows you to add blocks of text and images and make use of all the same formatting options you’re used to seeing in your email editor, content management system or documentation software.
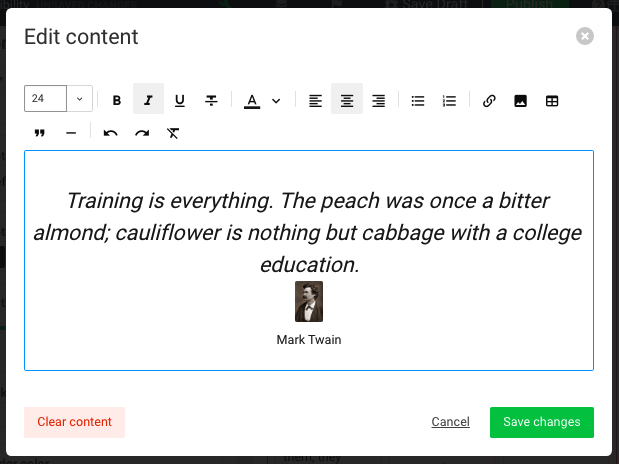
To help you create eye-catching text content that enhances the insight people gain from your dashboard, you can adjust the text size, style, colour and alignment as well as add bullet points or numbered lists. To supplement your written content, add links, tables, images, block quotes and horizontal rules.
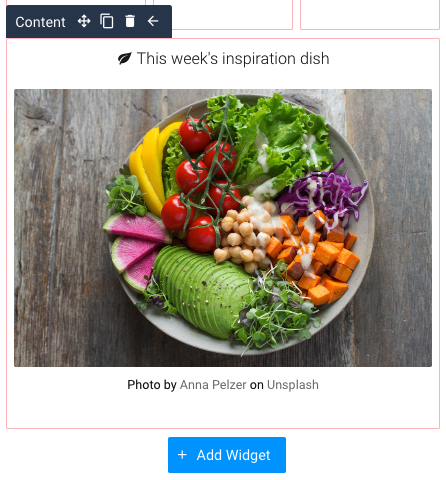
In addition to the material you can create within the content widget, like any other widget, you can also style it to fit the visual design of your dashboard or the canvas it’s contained within.
Add instructions to all dashboard components
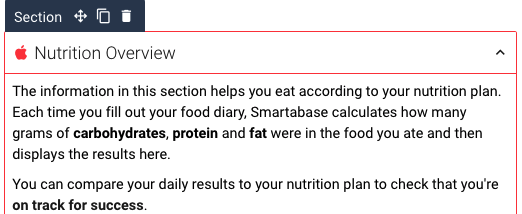
As well as the new content widget, we’ve upgraded all other dashboard components with the ability to include content via a new instructions property. The instructions property can be found in the sidebar of each dashboard component (each of your canvases, sections or widgets). When you add instructions, you’re able to make use of the same functionality available from the content widget. This means that each section, chart or tile, for example, can benefit from richly formatted explanatory information or instructions.
Reference image data in tiles and tables
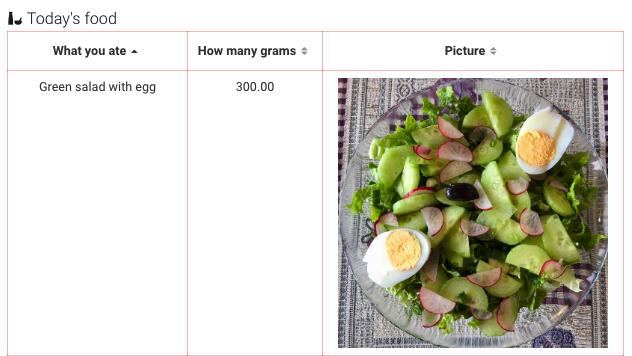
You can now add image data from event forms into your dashboard using the new image data type for tile and table widgets. You can set the image size to suit its placement within a tile or table, and when people view an image they can select it to see it in full-screen mode if necessary.
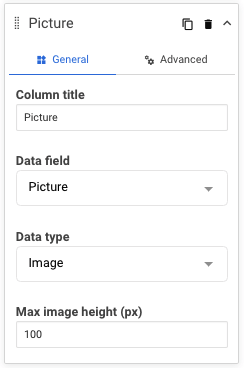
This feature works with the image field type for event forms.
General improvements and bug fixes
- We’ve improved the select box widget’s general stability.
- The automatic repair warning banner should no longer reappear when switching tabs if you’ve already dismissed it.
Bug fixes that were released between 2.29 and 2.30
- We resolved an issue where tables would not obey default sort settings for columns other than the first column.
- We updated the behaviour of the Y2-axis tick format for categorical charts so it doesn’t erroneously use the Y1-axis tick format setting.
- We fixed a problem that meant summary cells for aggregation table columns would still be shown when the column they were part of was hidden (for example, when using the property to hide columns that have no data).
- When you load dashboards using the Smartabase Athlete app, they should now consistently load the required data.
Highlights from your last dashboard builder release notes
In the last release notes we announced:
- Column summaries for aggregation tables.
If you missed them, you can read the last dashboard builder release notes.