We’re pleased to bring you more good news about our improvements to Smartabase’s dashboard builder.
If you haven’t tried the dashboard builder yet, check out our helpful guide. We’ll show you how to set up dashboards, use dashboard components and understand the data being displayed within your dashboards.
Expect the 2.17 update to become available to you shortly.
Explore your data with the new radar chart widget
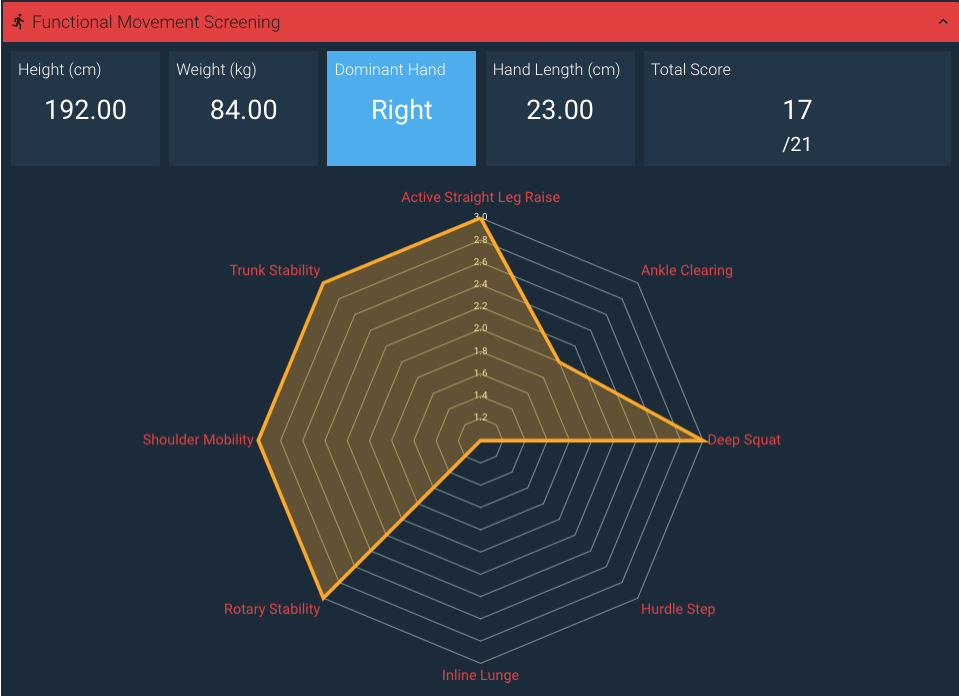
Radar charts are a useful way for you to show multiple data points and the variation between them. You can use a radar chart to compare values for several variables at once, as seen in our example above, which explores the functional movement screening results for an athlete.
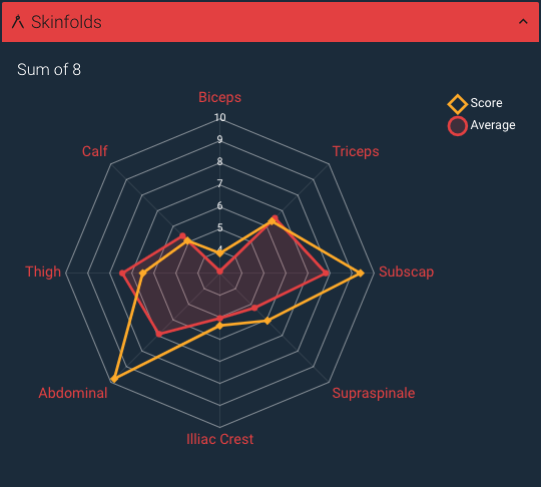
Like other chart widgets, you can filter the data source for the radar chart to show information about a single athlete or even to look at how an athlete compares to the rest of their team, like in the following example.
More options for customising widget titles and subtitles
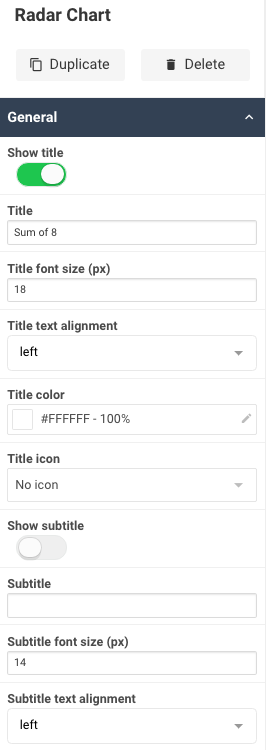
You can customise the titles and subtitles for all widgets to display more exactly how you want them to. With the new general properties, you’re able to:
- Choose whether you want a widget’s title or subtitle to be visible or not.
- Set the font size (in pixels) of titles and subtitles for your charts, date pickers, tables and select boxes.
- Decide how you want the title and subtitle text to be aligned.
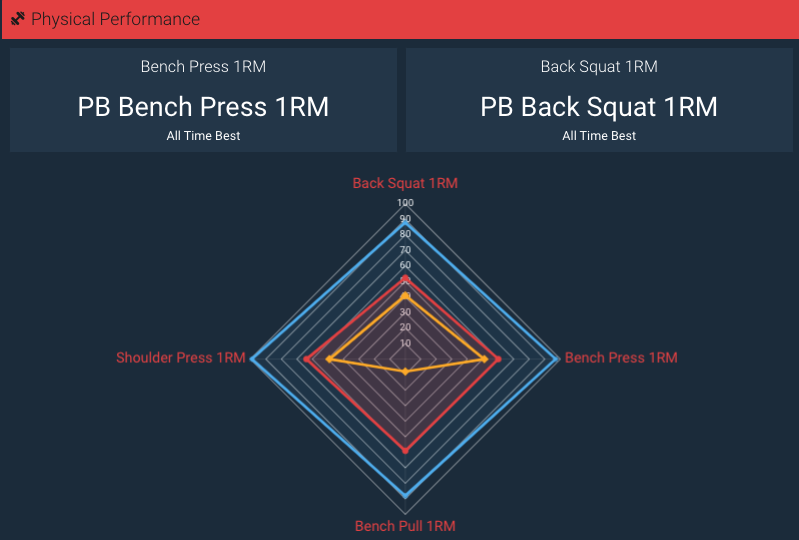
In the example below, we’ve centre-aligned the titles of the tile widgets, hidden their subtitles, and also hidden the title for the radar chart widget.
General improvements and bug fixes
- You can now choose the date display format for the date picker widget.
- The select box widget now has a button for clearing unwanted selections.
- Data labels and tooltips are no longer displayed for null data points on charts.
- We’ve optimised the table widget for printing – sorting icons are hidden on your print-outs.
- When you’re building a dashboard, you can now expand more than one section of the sidebar at a time.
- We’ve fixed an issue where data would be incorrectly filtered when comparing to null values.
- We resolved a problem where plotting negative values would cause errors on the XY scatter charts.
- Record cards now display the form name correctly if you re-name your event form.
You can contact your lead builder if you have any questions about building dashboards or visit the dashboard builder guide.
Highlights from your last dashboard builder newsletter
In your last newsletter we announced:
- Better support for using avatars within the table widget.
- More default settings to streamline use of your dashboards.
If you missed it, you can read the last dashboard builder update here.